Phase 2 · EDA & Modeling
EDA, Feature Engineering,
and Business Framing
Craigslist Cars & Trucks · Price Prediction Study
Executive Summary
This stage moves from data cleaning into exploratory analysis, feature engineering and a first price model. Asking prices are heavily right-skewed, so the analysis works on the log of price. Vehicle age and miles-per-year were engineered as new features and brands were grouped into Luxury and Standard tiers. A linear regression on log(price) reached an R² of 0.58 on held-out listings. Vehicle age is the strongest price driver: each extra year lowers the asking price by about 6.8%, and every 10,000 miles by about 3.6%, with body type, fuel, drive and brand tier held fixed.
A4
EDA: Distributions and Relationships
Raw vs. Log-Transformed Price Distribution
Price Distribution — Raw vs. Log Scale
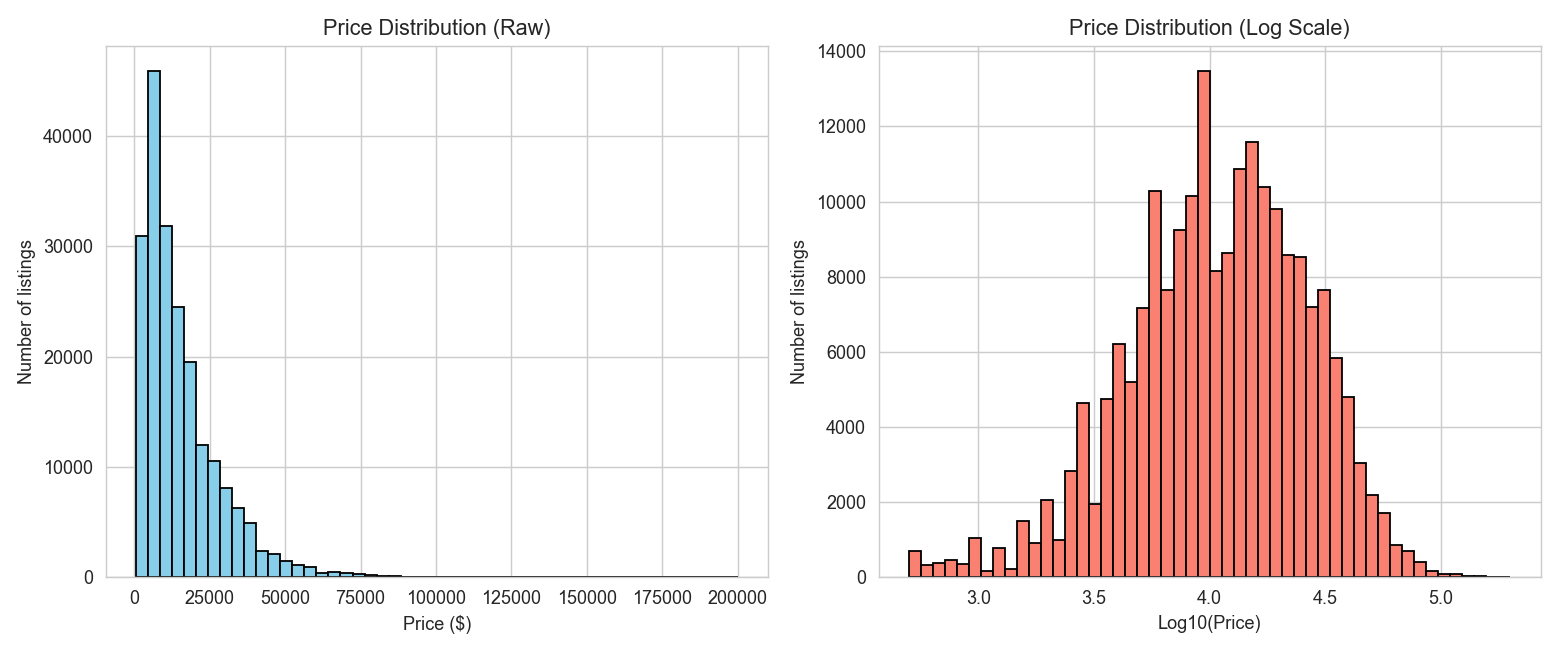
Fig 1 — Left: Price ($) · Right: Log10(Price)
Normalization
The raw distribution is heavily right-skewed with a long tail. Skewness falls from 2.33 on the raw price to −0.43 on the log price, which is close to a symmetric bell curve.
Granularity
The log scale expands the dense low-price region and compresses extreme high-end outliers, giving equal modeling weight to all price tiers.
Variance Stabilization
On the log scale the spread is more even, and the model treats a 10% price change consistently whether the base price is $5,000 or $50,000.
A4
EDA: Distributions and Relationships
Price vs. Odometer — Segmentation by Fuel · Transmission · Drive
Median Price by Odometer — Fuel, Transmission and Drive Type
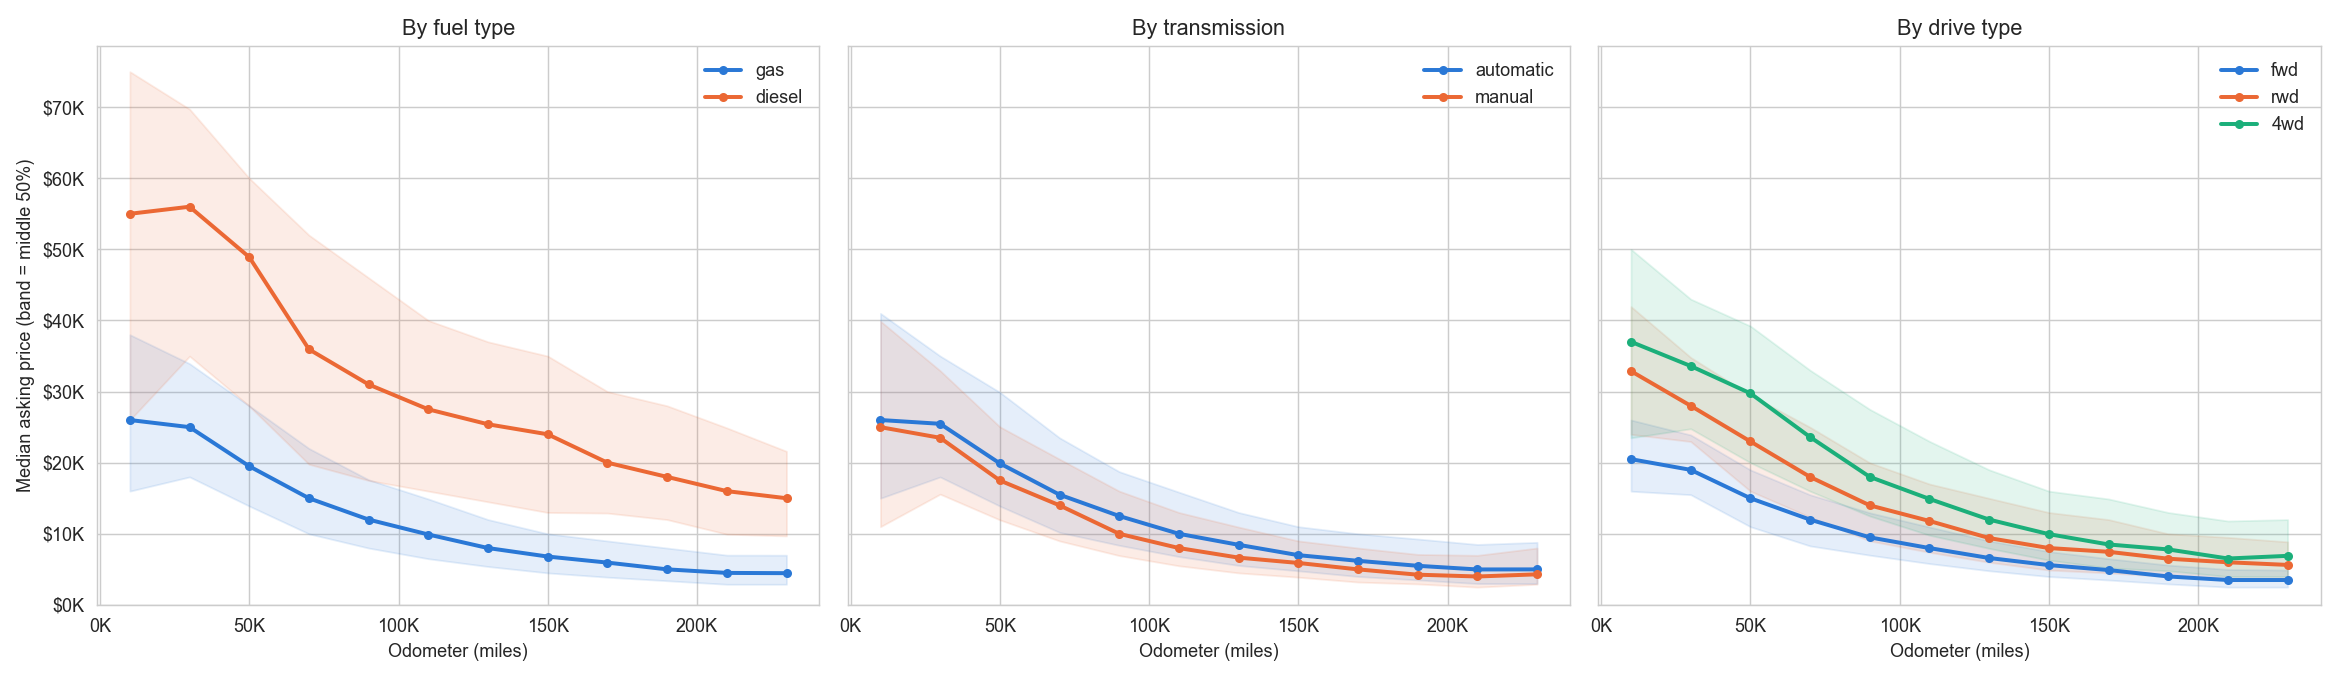
Fig 2 — Median asking price per 20,000-mile band · Shaded band = middle 50% of listings
Fuel Type
Diesel sits far above gas at every mileage — $31,000 against $12,000 at 80–100K miles. Most diesel listings are heavy-duty pickups, so part of this is a truck effect.
Transmission
Automatic and manual follow almost the same curve. Manual is slightly lower at every mileage ($10,000 against $12,500 at 80–100K miles).
Drive Type
4WD is highest, RWD in between and FWD lowest at every mileage — $18,000, $14,000 and $9,500 at 80–100K miles.
A4
EDA: Distributions and Relationships
Price vs. Model Year — Segmentation by Fuel · Transmission · Drive
Median Price by Model Year — Fuel, Transmission and Drive Type
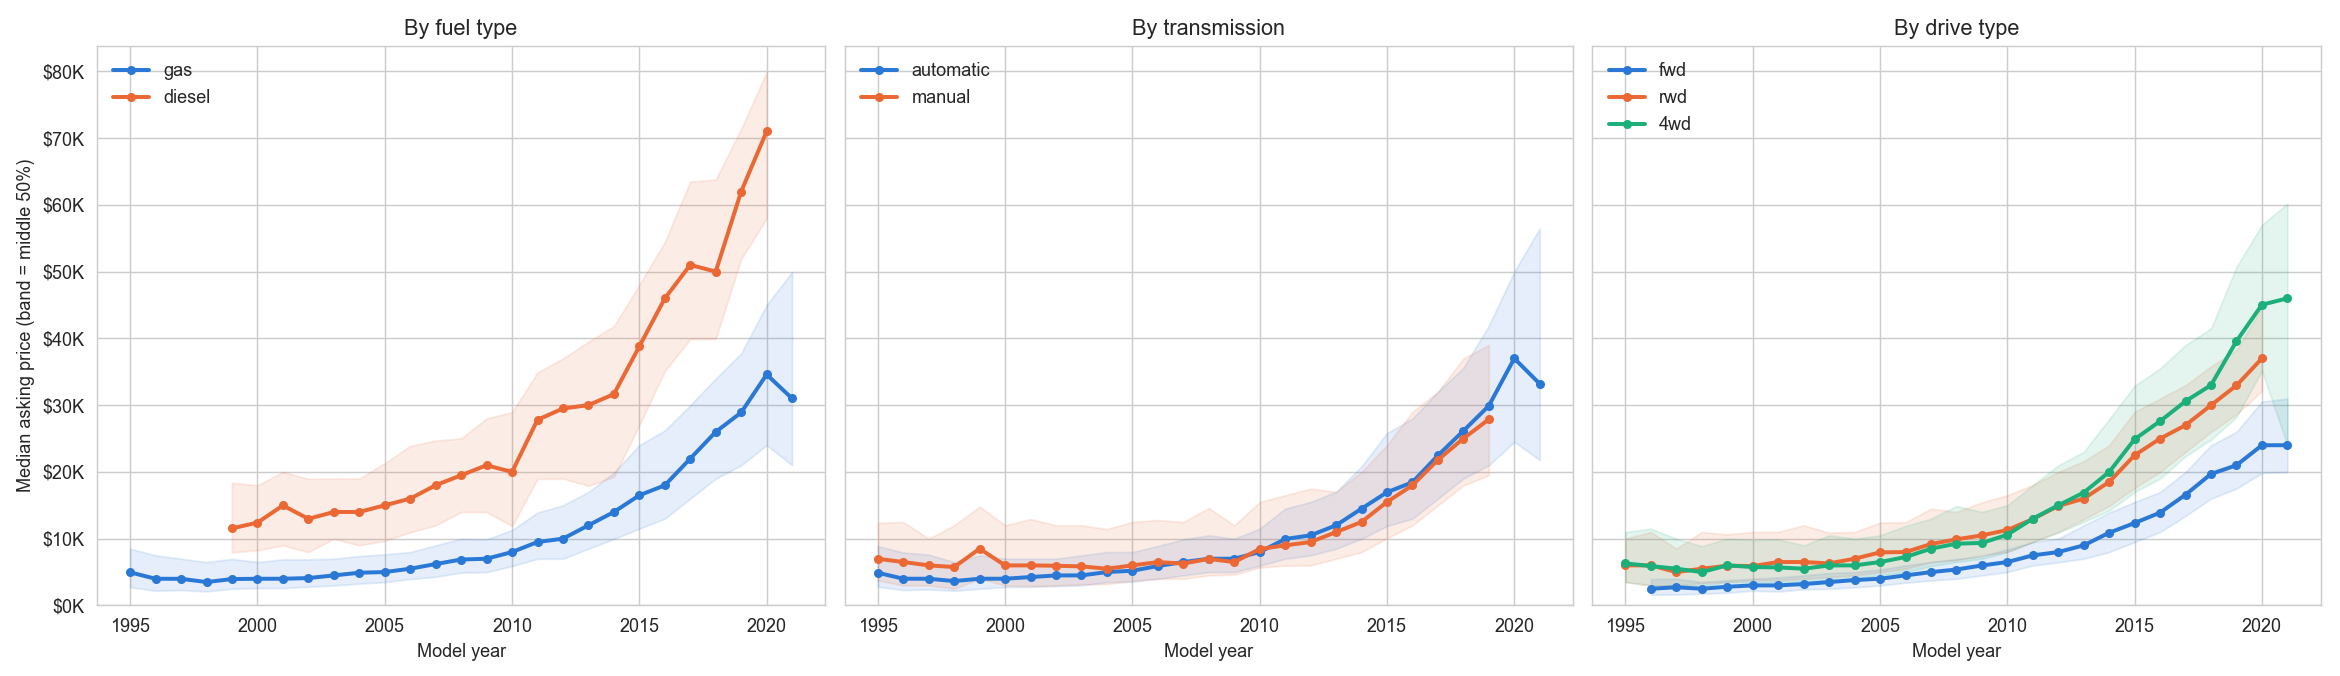
Fig 3 — Median asking price per model year · Shaded band = middle 50% of listings
Fuel × Year
The diesel gap exists in every model year and widens for newer vehicles — $38,800 against $16,500 for 2015 models.
Transmission × Year
For model years before 2006, manual cars are listed higher than automatics; for newer cars the two are almost equal. This is why manual shows a small premium once age is held fixed (A6).
Drive × Year
FWD is lowest in every model year, while 4WD and RWD stay close together ($24,900 and $22,500 against $12,300 for 2015 models). The gap is not just 4WD vehicles being newer.
A4
EDA: Distributions and Relationships
Brand Analysis — Price by Manufacturer & Era
Price Distribution by Brand & Model-Year Era
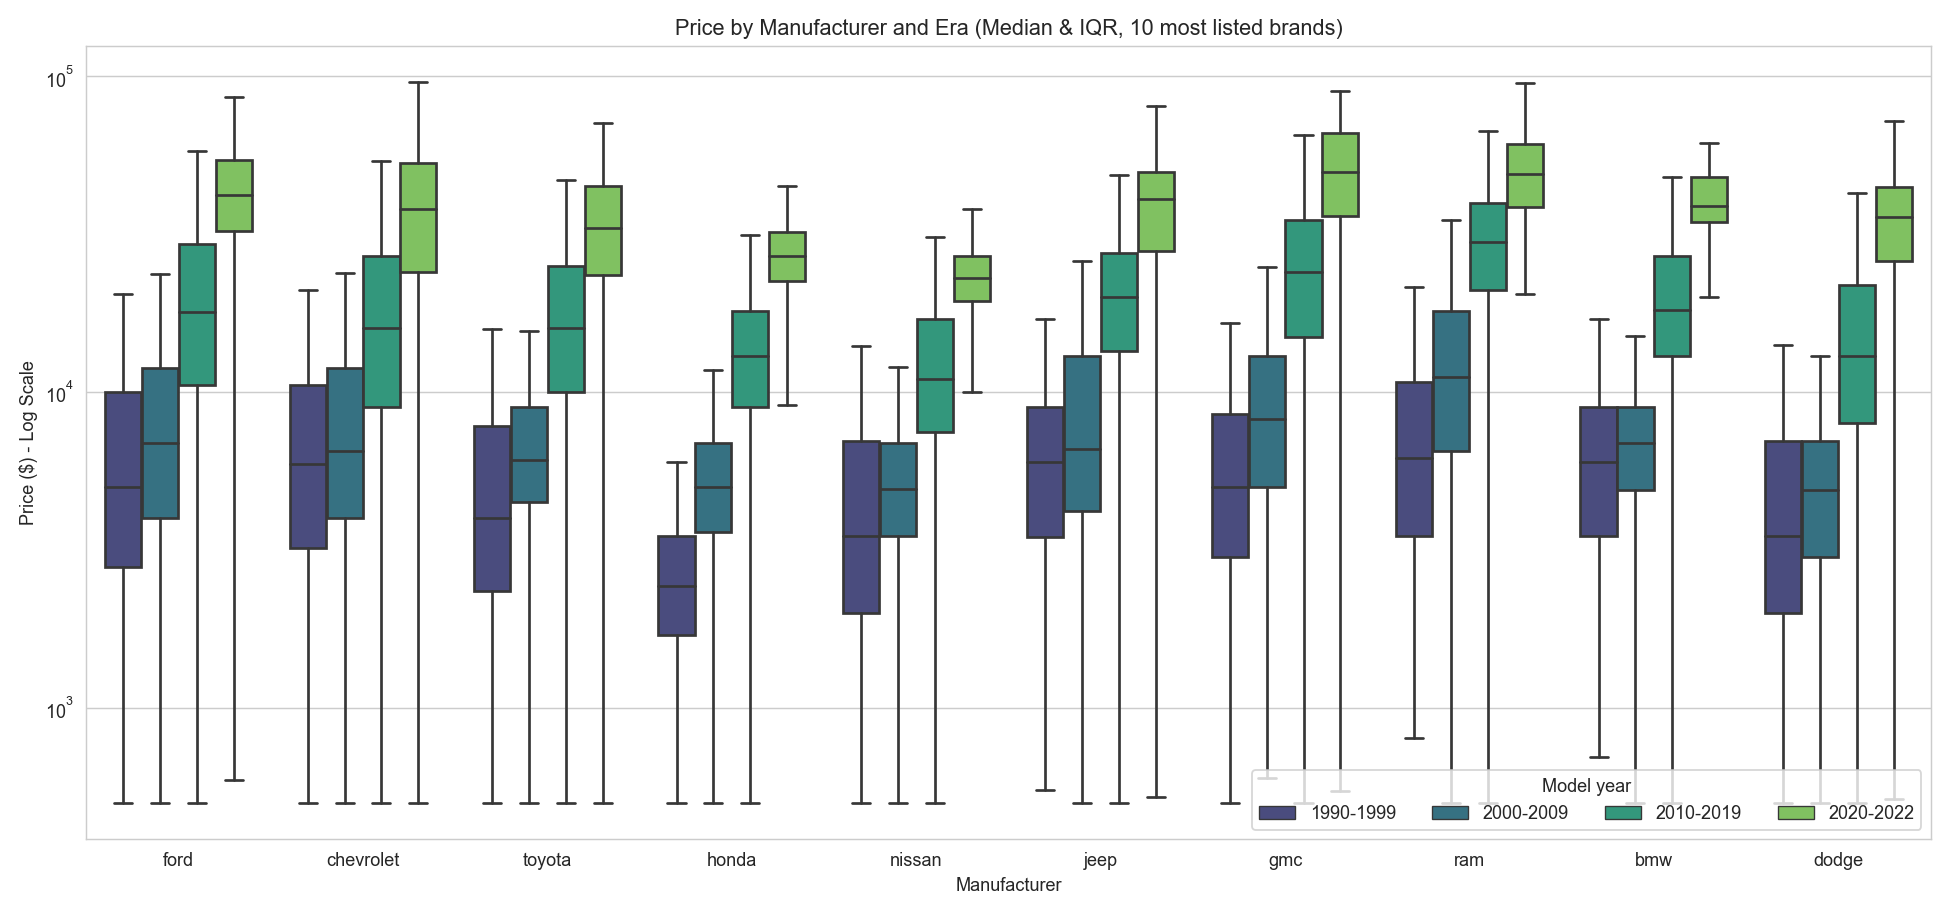
Fig 4 — Median and IQR for the 10 most listed brands · Eras: 1990–1999 · 2000–2009 · 2010–2019 · 2020–2022
Brand Value Hierarchy
Among the ten most listed brands, Ram, GMC and Jeep have the highest median asking prices ($24,950, $16,000 and $15,500), while Honda and Nissan have the lowest ($8,151 and $8,995).
Era–Price Relationship
The 2020–2022 era shows the highest prices for every brand, and each older era steps down — age matters more than the badge.
Modeling Implication
Brand alone is not enough — a brand's typical price depends heavily on how old its listed cars are, which motivates using Vehicle Age next to the Brand Segment feature in A5.
A5
Feature Engineering
Engineered Features
| Feature | Logic | Rationale |
|---|---|---|
| vehicle_age | 2021 − model year (minimum 0) | Converts model year into an interpretable depreciation signal. The reference year is 2021 because every ad was posted in April–May 2021, so this is the age at listing. |
| miles_per_year | odometer ÷ max(vehicle_age, 1) | Normalizes usage intensity across ages. Floor of 1 applied to avoid division-by-zero for new vehicles (age = 0). |
| brand_segment | Luxury / Standard classification | Groups manufacturers into two market tiers using a fixed, explicit list, reducing cardinality while preserving a brand value signal. |
Brand Segment Classification & Encoding Strategy
★ Luxury Tier — Predefined List
AcuraAlfa RomeoAston MartinAudiBMWCadillacFerrariInfinitiJaguarLand RoverLexusLincolnMercedes-BenzPorscheTeslaVolvo
Encoding Decisions
Model column: Top 20 most frequent models retained; all remaining grouped as "Other". Prevents feature explosion (the column has about 24,000 distinct strings) while preserving signal for high-volume models.
Low-cardinality columns (body type, fuel, transmission, drive, brand segment): Encoded via one-hot encoding — with the most common value as the baseline, so every coefficient reads as a difference from a typical car.
Low-cardinality columns (body type, fuel, transmission, drive, brand segment): Encoded via one-hot encoding — with the most common value as the baseline, so every coefficient reads as a difference from a typical car.
A6
Business Question + Narrative
Model R²
0.58
Of the variance in log price, on test data
Age Effect
−6.8%
Per additional year of vehicle age
Mileage Effect
−3.6%
Per additional 10,000 miles
Typical Error
25%
Median error, as a share of the asking price
Feature Importance & Model Accuracy Plots
What Drives Price Most?
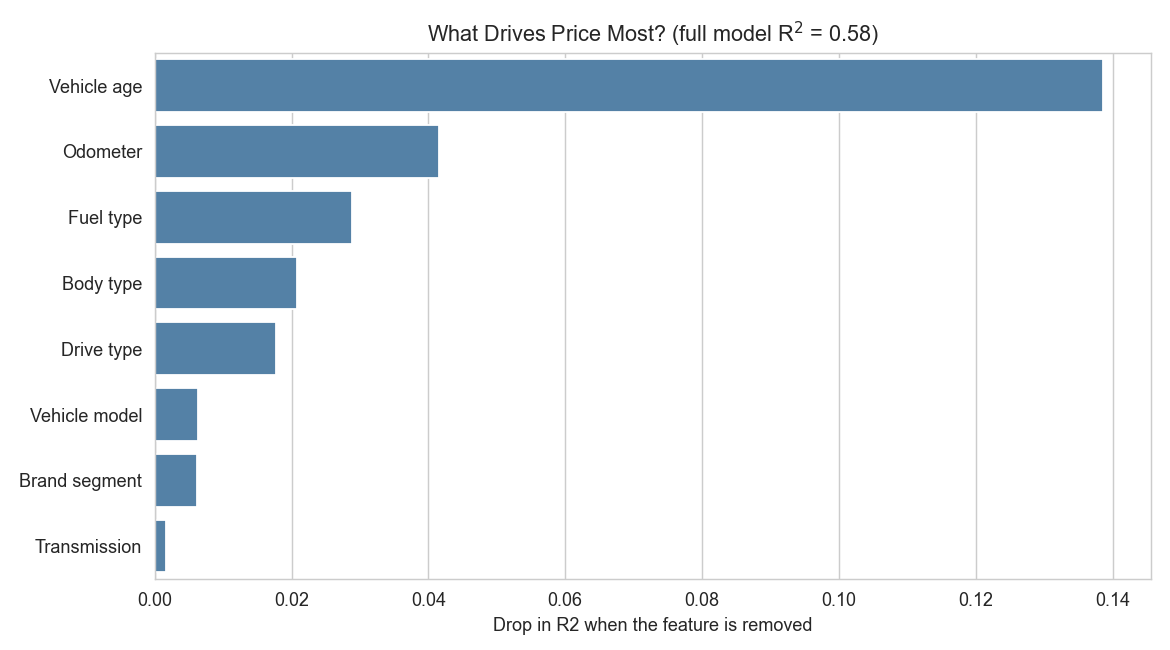
Fig 5 — Drop in R² when each feature group is removed from the model
Model Accuracy: Actual vs. Predicted Prices
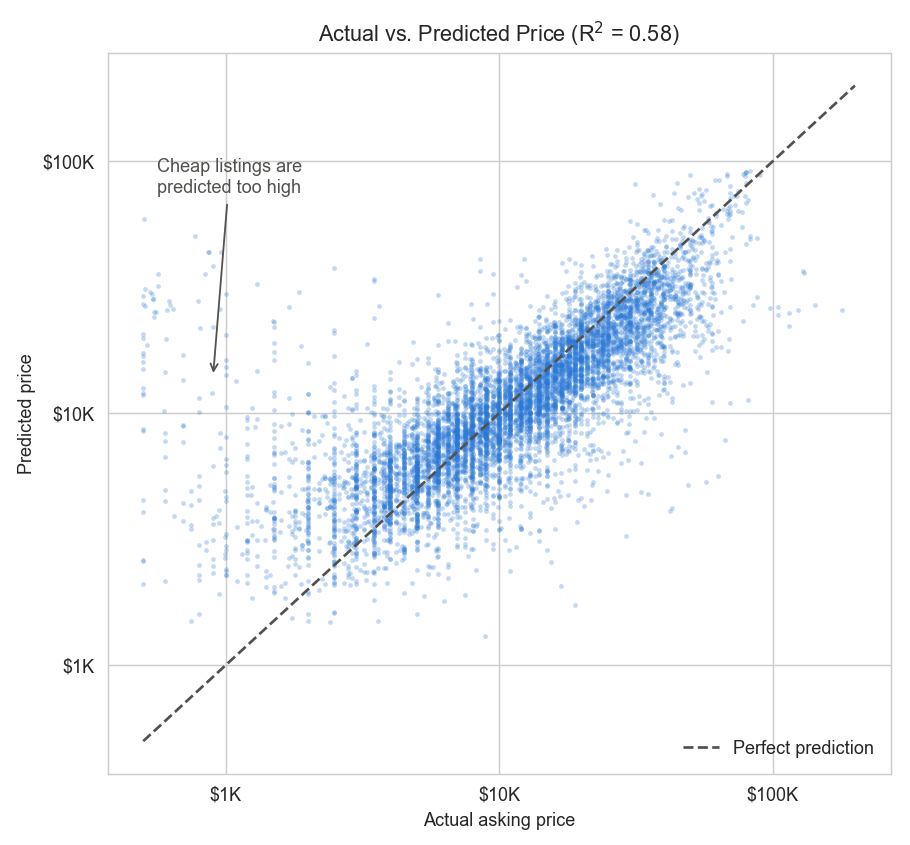
Fig 6 — Actual vs. Predicted Prices, log axes · Sample of 8,000 test listings (R² = 0.58)
Model Conclusions
Age Dominates
Removing vehicle age drops the model's R² from 0.58 to 0.44 — more than three times the effect of removing odometer, the next most important feature.
Truck & Off-Road Premium
Compared with a sedan of the same age and mileage, pickups are listed about 65% higher and off-road vehicles about 70% higher. Among individual models, the Wrangler carries the largest premium.
Where the Model Fails
Very cheap listings are predicted too high. 82% of the listings priced under $2,000 are predicted at more than double their asking price, against 4% of all other listings. These are likely cars with problems the data does not record, or down payments typed in as the price.
Robust Depreciation Rate
Refitting inside each brand tier gives almost the same age effect (−6.6% per year for both Standard and Luxury brands). Mileage costs more for luxury brands (−5.2% per 10,000 miles against −3.1%).
Limitations & Caveats
Missing Condition Data
The model's primary limitation is the absence of vehicle condition information (scratches, accident history, mechanical state) — a key driver of real-world price variation.
Asking Price Bias
The dataset contains listed asking prices, not actual transaction prices, introducing an upward bias that may not reflect real market-clearing values.
Model Baseline
At R² = 0.58, the linear model is a reasonable explanatory baseline but leaves predictive power on the table. Non-linear models (e.g., Gradient Boosting) are the natural next step.
🏁 Key Takeaways
01
Vehicle age is the #1 price driver. Each extra year lowers the asking price by about 6.8%, and every 10,000 miles by about 3.6%.
02
Diesel and 4WD vehicles are listed higher at every mileage and model year, largely because they are trucks and SUVs.
03
Age matters more than the badge. A 2020s Honda is listed well above a 1990s BMW.
04
R² = 0.58 is a baseline, not a ceiling. Condition and trim level are missing from the data, and prices are asking prices.